Methodology
This page gives the formula behind every calculator and statistic and the source of every live number. Which source we query how often is listed under About the data.

Data foundation
What every number is built on, and what of it is ours.
Our own data and external sources
The data from our own Bitcoin full node (all network metrics and the live mempool) and our own node crawler (the world map) are ours, as are the curated database and every computation on top.
What comes from outside are mainly the prices (live from Coinbase, historical exchange data), the euro conversion (ECB reference rates via frankfurter.app), market cap and volume (CoinGecko), the Fear & Greed index (alternative.me), the series for inflation, interest rates and the exchange rate (FRED), and gold and an MSCI World ETF (Yahoo Finance). We fetch, store and process all of that ourselves.
So "own data" here means: our own node, our own crawler, our own fully stored history and our own computation.
Price data
The basis is our own, fully stored price database: over 1.5 million records on a 5-minute grid since 1 January 2012, plus daily data from 18 July 2010 (the start of trading on Mt. Gox). All timestamps are UTC.
The prices come from exchanges, the daily prices for 2010 and 2011 from a backfill. We checked the history against several exchanges and filled isolated gaps with minute prices. Going forward, our server polls the price every 30 seconds and stores one value every 5 minutes.
Before 2012 there is only daily data: in 2010/2011 Bitcoin traded on a few small exchanges with little volume, not enough for clean 5-minute candles. A daily reference price is the most reliable figure that can be reconstructed for that period.
US-dollar prices are the prices traded on exchanges. Stored euro values are converted from the dollar price at each day's ECB reference rate, day-accurate across the whole history and for every new record as well. Only the current live price is Coinbase's euro price, so it can differ slightly from the stored value. Which currency is shown is chosen top right; it is independent of the language.
Network data & our own node
Blocks, block height, difficulty, hashrate, mempool size and fees come primarily from our own self-hosted Bitcoin full node (REST for the metrics, WebSocket for the live mempool). We use it as long as it is reachable and at most 2 blocks behind the public network. Otherwise a health check switches automatically to mempool.space.
Market metrics such as market capitalisation and trading volume come from CoinGecko, the Fear & Greed index from alternative.me. Which source we query how often is documented under "About the data".
Reference data: inflation, rates, gold & ETF
For the purchasing-power page we need comparison series our price database does not contain. From FRED (Federal Reserve Economic Data) come the consumer price index of the euro area (HICP) and the US (CPI-U), the ECB deposit rate, the US Federal Funds rate and the EUR/USD exchange rate. From Yahoo Finance come the gold price (COMEX GC=F) and the price of the iShares Core MSCI World UCITS ETF. We fetch all of it daily or on business days and store it on our side; on the pages it is marked as external reference data.
The ECB reference rates we use to convert the stored euro values come via frankfurter.app.
Calculators
Idealised simulations from real prices.
DCA calculator
For each buy date in the chosen interval we take the daily close, the last price of that calendar day (UTC) in our price database, and compute how much Bitcoin the fixed amount would have bought at that price. Contributions and the Bitcoin bought are summed over the period.
Today's value = accumulated BTC × current price. Return = (today's value - total contributions) ÷ total contributions. No fees or spreads enter the calculation; it is an idealised simulation.
What-if
A one-off investment: the entered amount buys a BTC quantity at the daily close of the chosen day from our price database; its value today follows from the current price. Same data basis as the DCA calculator.
Converter
Converts BTC, satoshis, euros and US dollars against each other live. 1 BTC = 100,000,000 satoshi is fixed; the fiat conversion uses the current Coinbase live price in US dollars and euros (updated every 30 seconds).
Fee calculator
Transaction fee = transaction size (in virtual bytes, vB) × fee rate (sat/vB). The current fee rates (fastest, ~30 min, ~1 h) come live from the mempool. SegWit transactions are smaller (fewer vB) and therefore cheaper.

Own statistics
What our own price series makes computable.
Yearly returns & returns triangle
Yearly return = last price of the year versus the first recorded price, in percent, per currency from its own price series (euro return from euro prices, dollar return from dollar prices). High and low are the maximum and minimum of all prices in the year. The table lists completed calendar years only, 2010 starts in July (market start). In the year overview the current year appears as a dashed square.
Max. drawdown = the deepest fall from the year's running high to a later low within the same year. A daily low only counts against the highs of the preceding days, because the order of high and low within a day is unknown.
The returns triangle shows, for every combination of buy year (bought at the first price of the year) and sell year (sold at the last price of the year), the average return per year over the whole holding period (annualised). The diagonal is the return of that single year.
All-time high & drawdown
The all-time high is the highest price ever recorded, separately per currency: the euro high can fall on a different day than the dollar high. The current distance (drawdown) = (current price - ATH) ÷ ATH in the same currency, plus the number of days since the ATH.
Drawdown zones & droughts
The gauge for the distance from the all-time high uses our own distribution: for every day since the July 2016 halving, the close against the highest price up to then, per currency. The 25th, 50th and 75th percentiles separate "deep bear", "bear", "correction" and "near high". The years before are left out, because the crashes of the small, thinly traded market of the Mt. Gox era would pull the bounds down for today.
A drought is every completed break of at least 365 days between two all-time highs (daily high), across the whole series since 2010.
Time machine
The time machine compares the current price with the price on the same calendar day 1, 2, 3, 5 and 10 years ago. It takes the nearest record from our price database, at most 3 days away; if there is none, the row is left out. Multiple and return are computed per currency, which is why euro and dollar figures differ.
Volatility clock
For each hour we compute the relative range (high - low) ÷ low and average it across all data since 2012 per weekday-and-hour combination (all times in UTC). That reveals when Bitcoin moves the most on average, and that pattern needs the intraday resolution that only exists from 2012 on.
Is Bitcoin a bubble?
The bubble check is computed from daily closes in US dollars (last price per UTC day): every drop of more than 50% from the prior high, the returns over every rolling holding period of 1 to 4 years (worst, median, best and share of positive windows), volatility per year (annualised standard deviation of daily log returns) and the long-term trend as a linear regression of log(price) over log(days since the genesis block in 2009).

Cycles & patterns
Descriptive patterns from our own price series: small samples, no forecast.
Bitcoin cycle
Each cycle is aligned to "days since halving". The cycle page shows the completed cycles as real price paths, each rebased to 100 at today's cycle day. That shows how the price developed from this point in earlier cycles. There is no median, no cone and no price target: with three cycles that would be false precision. The phase bands are a fixed naming by day windows, not a detector.
Plus base rates: per weekly RSI signal (see below) the return after 1, 3, 6 and 12 months, the hit rate as a fraction with n and a Wilson 95% interval. With samples this small the interval is correspondingly wide.
The price-based market phase follows from the 365-day return: capitulation (≤ -35%), sideways, euphoria (≥ +100%). The thresholds are fixed; because the swings shrink from cycle to cycle, they fit less well over time.
30-day volatility
The volatility on the cycle page is the annualised standard deviation of the daily log returns over the last 30 days (daily closes in US dollars, × √365). It is ranked against the same value computed on a rolling basis for every day of the last 1,460 days (one halving cycle): below the 20th percentile it counts as calm, above the 80th as high. Comparing only with the last cycle is deliberate, because volatility from 2011 to 2017 was on an entirely different level; against the whole history almost everything today would read as calm.
RSI bottom signal
Weekly closes, Wilder RSI(14). A signal is the week the RSI falls from ≥35 to <35 (one per episode, reset only at RSI 50), detected from July 2011. Per signal we measure the return over +1/3/6/12 months and how close the actual cycle bottom was. The sample is very small; this is illustrative.
Seasonality
Monthly closes; monthly return = close ÷ previous close - 1. We use complete calendar years from 2013 only (before that the extreme early years distort the average). Per month we show mean and median (more robust) plus the hit rate. There are few values per month, so this is a rough orientation only.
Power-law corridor
Linear regression ln(price) = a + b·ln(days since the genesis block). The corridor is the quantiles of the deviations (residuals) from the trend: green = historically cheap, red = expensive. The fit runs over the whole history including today and shifts every day. That gives a reading relative to its own history and is not a forecast.
Purchasing power explorer
The purchasing-power page compares what an amount in dollars or euros would have become: as cash, in a savings account, in gold, in an MSCI World ETF or in Bitcoin. It is based on a weekly grid (every Friday since January 8, 1999, plus the latest available day) using the last value available on that day, at most 10 days old.
Bitcoin is the daily close from our price database (euros at the ECB reference rate of the day). Gold is the COMEX future GC=F in dollars per troy ounce (Yahoo Finance, from August 2000). The MSCI World is the iShares Core MSCI World UCITS ETF (Acc), ISIN IE00B4L5Y983, Xetra, daily close in euros (Yahoo Finance, from September 2009). It stands in for a global equity ETF and is not a recommendation. Gold and the ETF are converted with the EUR/USD rate (FRED DEXUSEU).
The savings account earns the US Federal Funds rate (FRED DFF) or the ECB deposit rate (FRED ECBDFR), compounded weekly, with negative rates counted as 0%; actual bank rates differ. Purchasing power = nominal × index of the start month ÷ index of the month measured, using the US CPI-U (FRED CPIAUCSL) or the euro-area HICP (FRED CP0000EZ19M086NEST); months without a published value use the last value before them. "Measured in Bitcoin" means sats per unit (100 million ÷ price) at the last daily close of each year.
All-time high after the halving & peak multiples
The halving page checks, per halving and per currency, whether the price set a new all-time high within 730 days. Previous high = highest price before the halving day (00:00 UTC), new high = the first record in the window above it. If the window is still running and there has been no new high so far, the cycle stays open instead of counting as "no".
The peak multiple is the highest price in the same 730-day window divided by the price on the halving day (nearest record), also per currency.
Halving simulator
The simulator sits on the halving page. From the completed cycles we compute each cycle's peak multiple (top ÷ price at halving); these shrink from cycle to cycle (diminishing returns). The next multiple = last × decline factor (conservative/moderate/aggressive from the historical factors). The multiples come from the dollar series; in euros the simulator applies the same multiples. It derives the absolute peak price from an assumed halving price, which defaults to the current price. That is an assumption and not a forecast.
Live network
Metrics straight from the blockchain.
Network metrics
Block height, difficulty and mempool come live from our node. The hashrate is the 7-day average: our node's estimate over the last 1,008 blocks, mempool.space's if the node is down; if neither answers, the rolling 7-day average of our own daily values applies.
Derived from them: circulating supply (from block height and the halving schedule), stock-to-flow (supply ÷ coins newly created per year), hash price (miner revenue per TH/s and day = block subsidy of 3.125 BTC × 144 blocks × price ÷ hashrate in TH/s, excluding fees) and a rough estimate of network security cost.
Blocks per day & difficulty gauge
Blocks/day = 2016 ÷ days between two difficulty adjustments, i.e. the measured block rate of an epoch. The gauge places it against the target of 144: below 138 slower, above 150 faster. Because the epoch is measured in whole days, 13 days give 155, 14 days 144 and 15 days 134 blocks; the bounds at ±4% separate exactly these cases.
The gauge for the next difficulty adjustment compares the expected adjustment with the adjustments of the last 4 years from our own daily values: below the 10th percentile it counts as low, above the 90th as high. If its size falls in the smallest fifth of all sizes it counts as flat, otherwise as falling or rising.
Live strip on the home page
The strip shows price, block height, hashrate, mempool and Fear & Greed. The price line is the last 24 hours in 30-minute averages from our price database. The hashrate line shows the rolling 7-day average over the last 30 days from our own daily values, the same definition as the figure next to it.
Mempool views
The basis is the next projected block with all its transactions, live via WebSocket from our own node; if the node is unavailable, the stream comes from mempool.space.
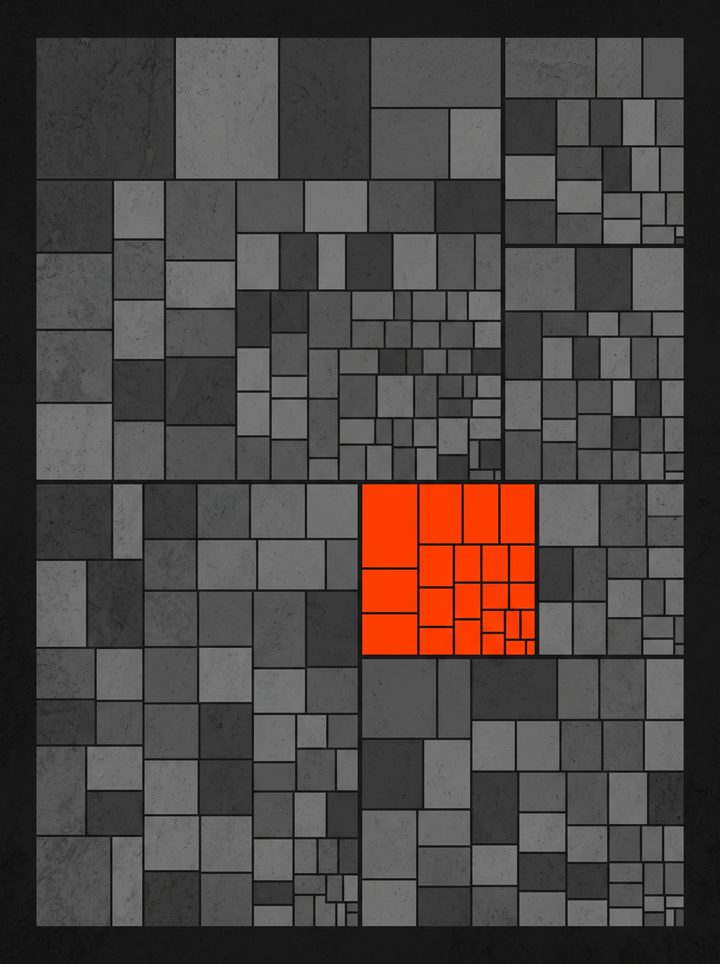
"Blocks" shows the next projected blocks with their fee range. The treemap shows every transaction of the next block as a rectangle: area = size in vB, colour = fee rate. The topology shows data volume and BTC value per fee range at the top and every transaction as a dot below. The spectrum sets data volume against the number of transactions per fee range. The dashed block-end line in topology and spectrum marks the lowest fee still inside the next block.
Fear & Greed index
We source the Fear & Greed index (0 = extreme fear, 100 = extreme greed) from alternative.me; we display it on the analysis page and in the live strip on the home page but do not compute it ourselves. It combines volatility, market momentum, social media, surveys, Bitcoin dominance and Google Trends into a single number.
Node explorer
We crawl the P2P network ourselves.
Network crawler
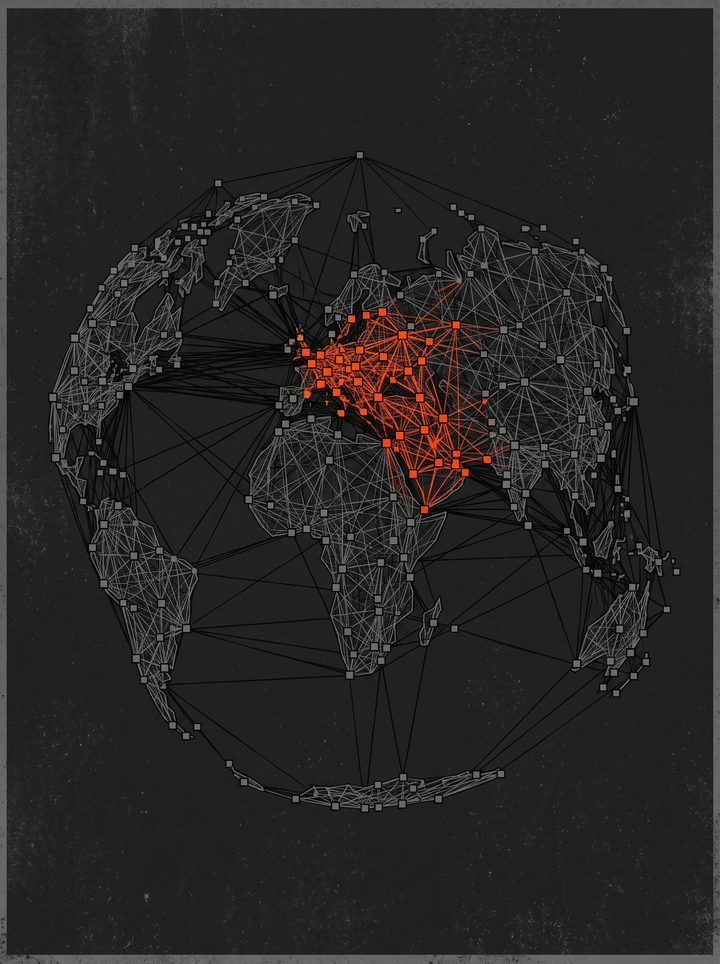
We talk to the Bitcoin P2P network directly: connect to known nodes, request their peer lists (getaddr) and try to connect to every address found. Reachable nodes are grouped by country (via GeoIP), client version and network on a live world map; that is currently around 16,200 reachable nodes.
We count machines, not endpoints: one address counts once, even if it answers on several ports. Otherwise a single server could expose many ports and inflate the figure at will. Bitnodes counts the same way. A clearnet node counts as reachable until it fails to answer three times in a row, and as offline at the latest 48 hours after its last answer.
We cover clearnet nodes over IPv4 and Tor nodes. The crawler does not currently cover IPv6 nodes, because our server has no IPv6 connectivity; nodes reachable only over IPv6 are therefore missing from the count.
Tor nodes
Tor nodes (.onion) are only reachable over the Tor network. We run several Tor instances in parallel (each building its own set of circuits) to probe thousands of onion addresses at once. That finds ~8,300 reachable Tor nodes instead of only a few dozen with a single connection.
A Tor node counts as reachable if it answered at least once in the last 24 hours. Onion connections often drop; counting failed attempts as on the clearnet would therefore report too few nodes.

Address tools
Privacy-preserving checks and lookups.
Validate address
Validates the address format purely by calculation: the Base58Check checksum for legacy and P2SH addresses and the bech32/bech32m checksum for SegWit and Taproot addresses. No network request is needed: an address is either mathematically valid or not.
Verify message
Recovers the public key from a signed message (ECDSA recovery) and compares the address derived from it with the one given. If they match, the holder of the key belonging to that address signed the message.
Check balance
The address check only looks up the balance once you click "Check balance", and only for mainnet addresses. We query the balance and activity server-side from mempool.space so your IP never reaches the provider. The searched address is not stored permanently.
Technical analysis
Deterministic indicators from our own price series.
Indicators & tension map
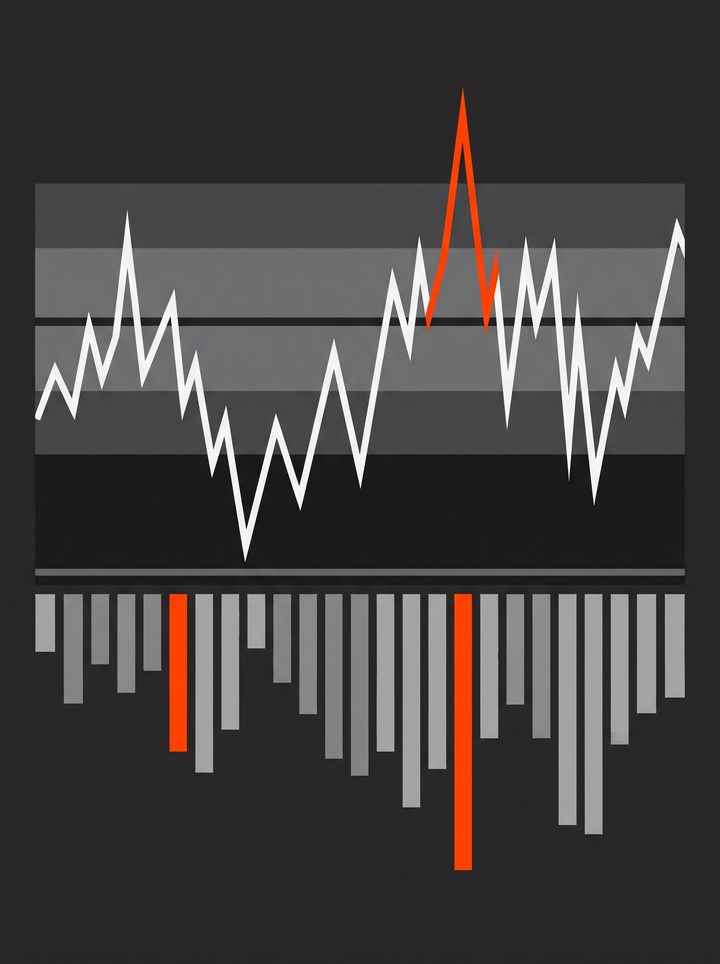
We compute all indicators deterministically from our own price series (daily closes, UTC): Wilder RSI(14), MACD from the exponential averages over 12 and 26 days with a signal line as a 9-period EMA, moving averages over 7/30/100 days, support/resistance from local extrema of the last 30 days.
The tension map places the market in a field of RSI (momentum) and price deviation from the 30-day average (trend strength). Indicators are descriptive and not a forecast.
Frequently asked questions
01Are the euro values real?
Yes. Stored euro values are converted from the USD price traded on exchanges at each day's ECB reference rate, day-accurate across the whole history. Only the current live price is Coinbase's euro price.
02Where does the network data come from?
Primarily from our own Bitcoin full node, with mempool.space as automatic failover. The node world map comes from our own crawler.
03Do you use external data too?
Yes, and we disclose it openly. The Bitcoin price comes live from Coinbase, the history from exchange data, euro via ECB rates, plus market data (CoinGecko), Fear & Greed (alternative.me), inflation, interest rates and the exchange rate (FRED), and gold and the ETF (Yahoo Finance). 'Own data' means our own node, our crawler, the fully stored history and all computations on top of it.